






Are you looking to create a bar chart in Elementor? Bar graphs are a popular and effective way to visually represent data and trends. With its simple and straightforward design, bar graphs are not only visually appealing but also easily understandable for viewers.
With the Chart widget from The Plus Addons for Elementor, you can easily convert your data into a bar graph on your Elementor website.
To check the complete feature overview documentation of The Plus Addons for Elementor Chart widget, click here.
Requirement – This widget is a part of The Plus Addons for Elementor, make sure it’s installed & activated to enjoy all its powers.
To do this, add the Chart widget to the page and follow the steps –
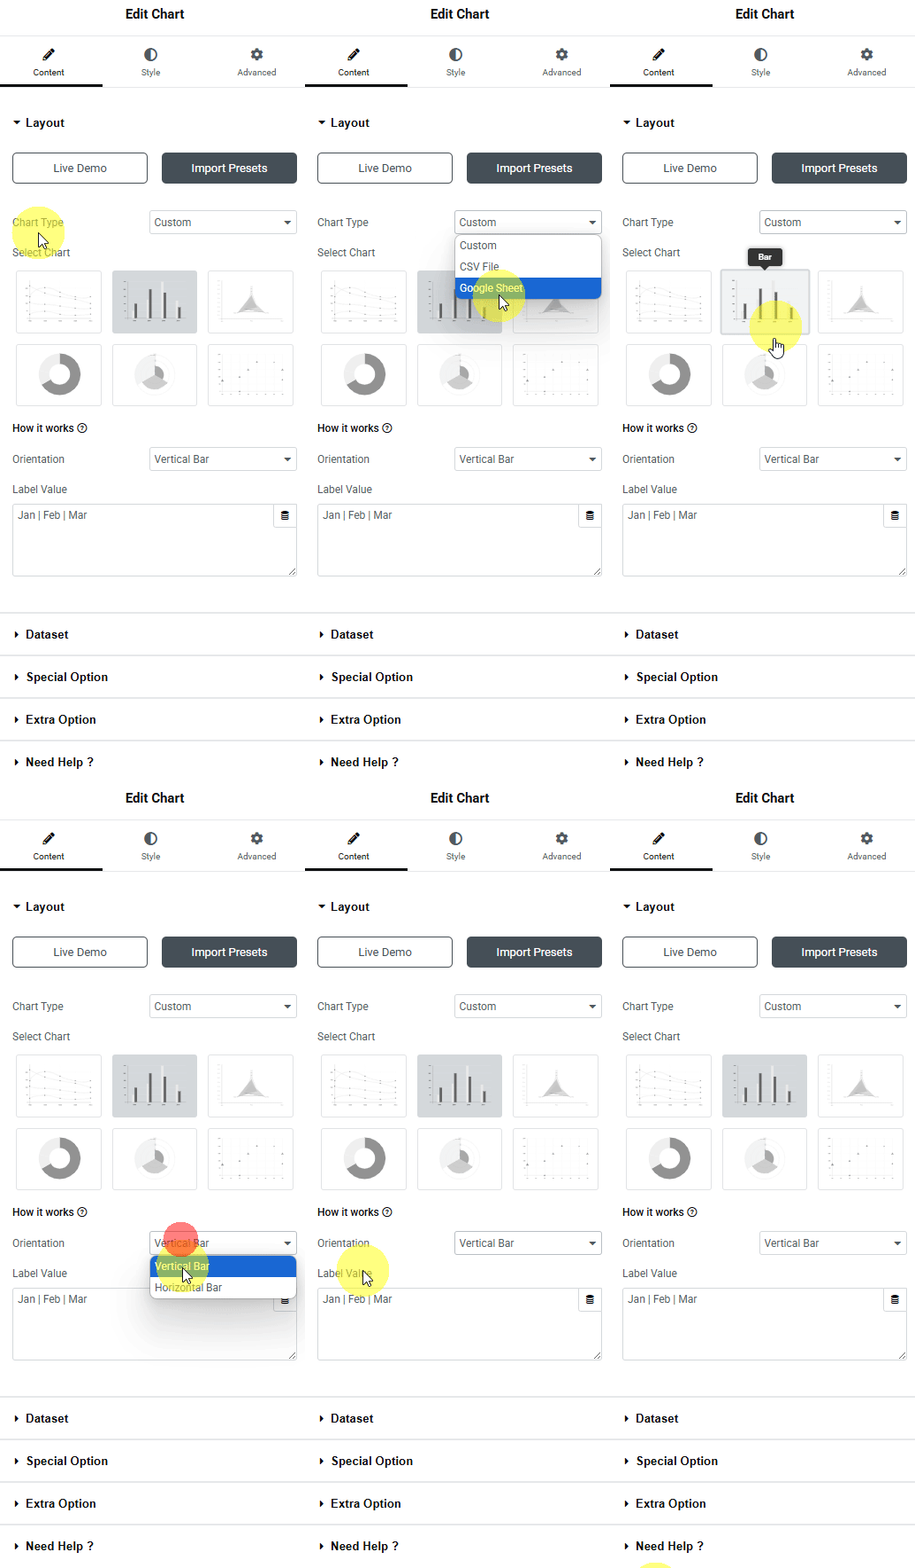
1. You can select Custom from the Chart Type dropdown under the Layout tab.
2. You have to select Bar from the Select Chart section under the Layout tab.
3. Then, from the Orientation dropdown, you can make the graph a horizontal bar or a vertical bar.
4. After that, in the Label Value field, you have to add chart labels separated by a pipe sign (|).
4. Then, in the Dataset tab, you have to add the data for the chart. You’ll find the same options as for the Line chart.
You can customize the chart further from the Special Option tab. From here, you can manage the bar size and bar gap, and the rest of the options are the same available for the Line chart.
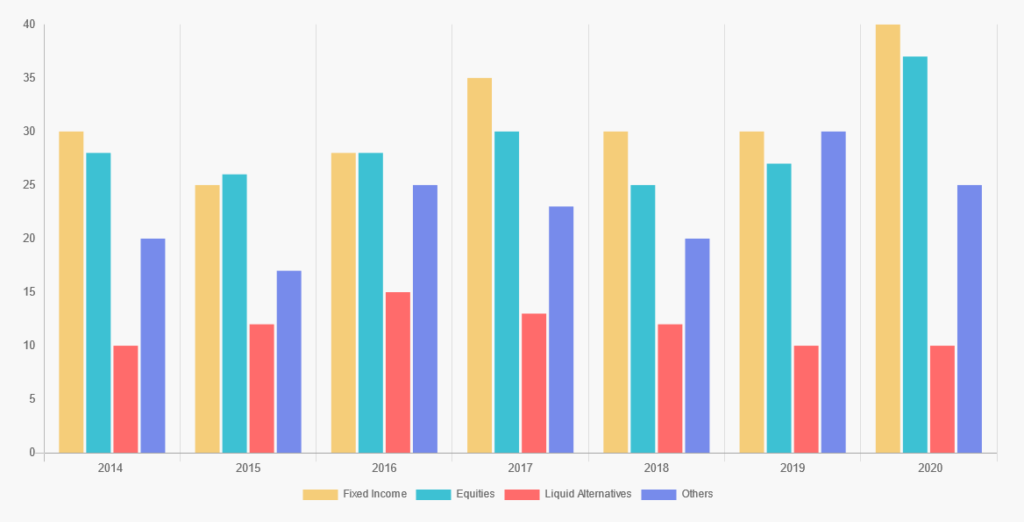
Now you should have an interactive bar chart.
Suggested Read: How to create a bubble chart in Elementor.
